34 Working with factors
You can follow along with the slides here if you would like to open them full-screen.
Ever made a bar chart where the categories were in a weird order? That’s where factors come to the rescue!
When you make a simple plot like this:
ggplot(cat_lovers, mapping = aes(x = handedness, fill = handedness)) +
  geom_bar() +
  labs(title = "Cat lovers by handedness") +
  theme_minimal() +
  scale_fill_viridis_d(option = "plasma")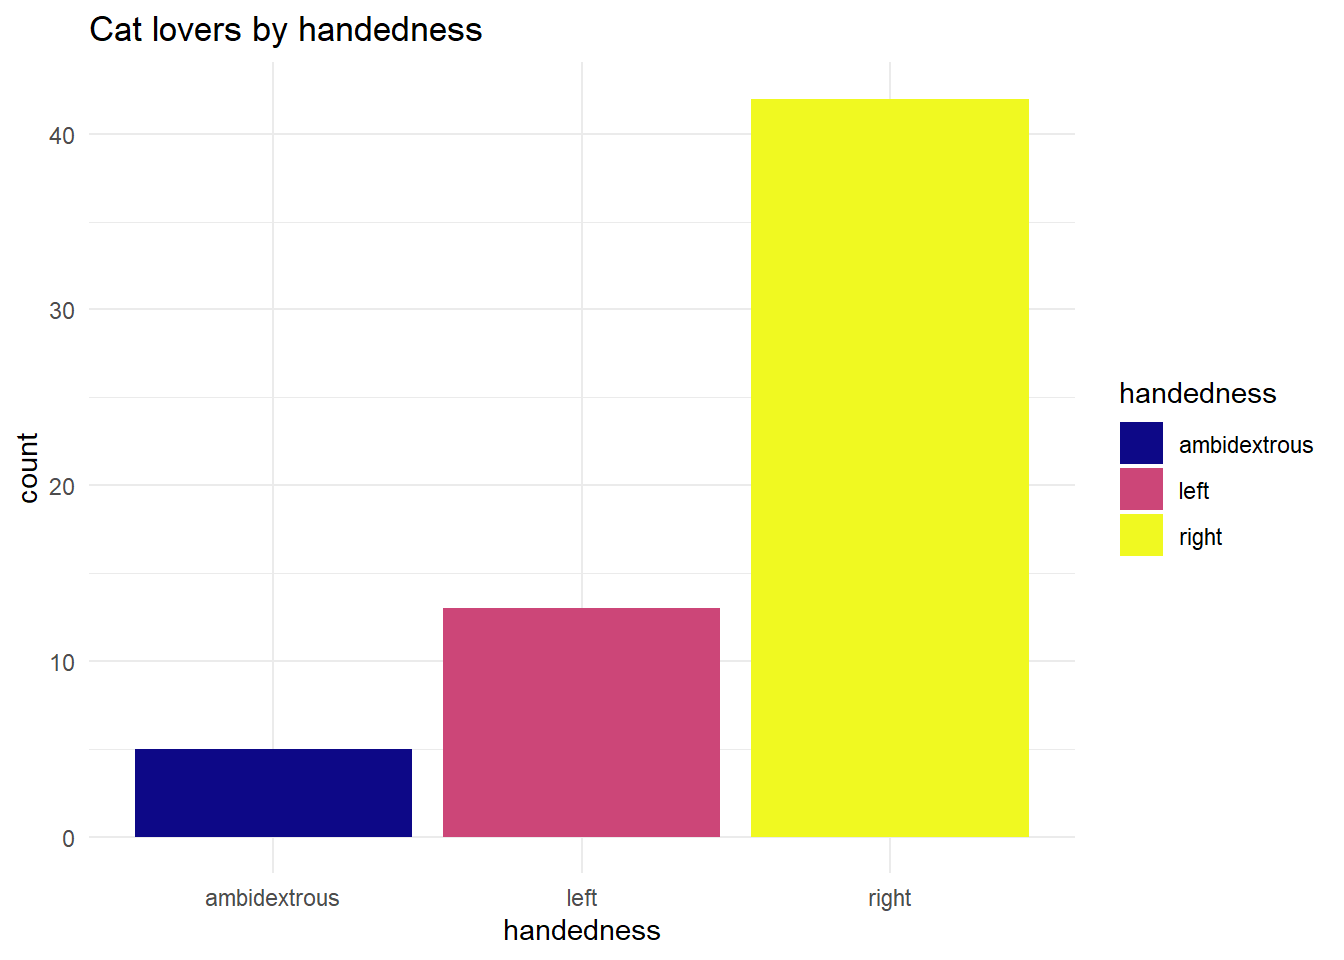
R automatically converts your text variable to a factor, but it uses alphabetical order by default. That’s rarely what you want!
The forcats package (part of the tidyverse) gives you superpowers for controlling factor order. Want categories ordered by frequency? Just use fct_infreq():
cat_lovers %>%
  mutate(handedness = fct_infreq(handedness)) %>%
  ggplot(mapping = aes(x = handedness, fill = handedness)) +
  geom_bar() +
  labs(title = "Cat lovers by handedness") +
  theme_minimal() +
  scale_fill_viridis_d(option = "plasma")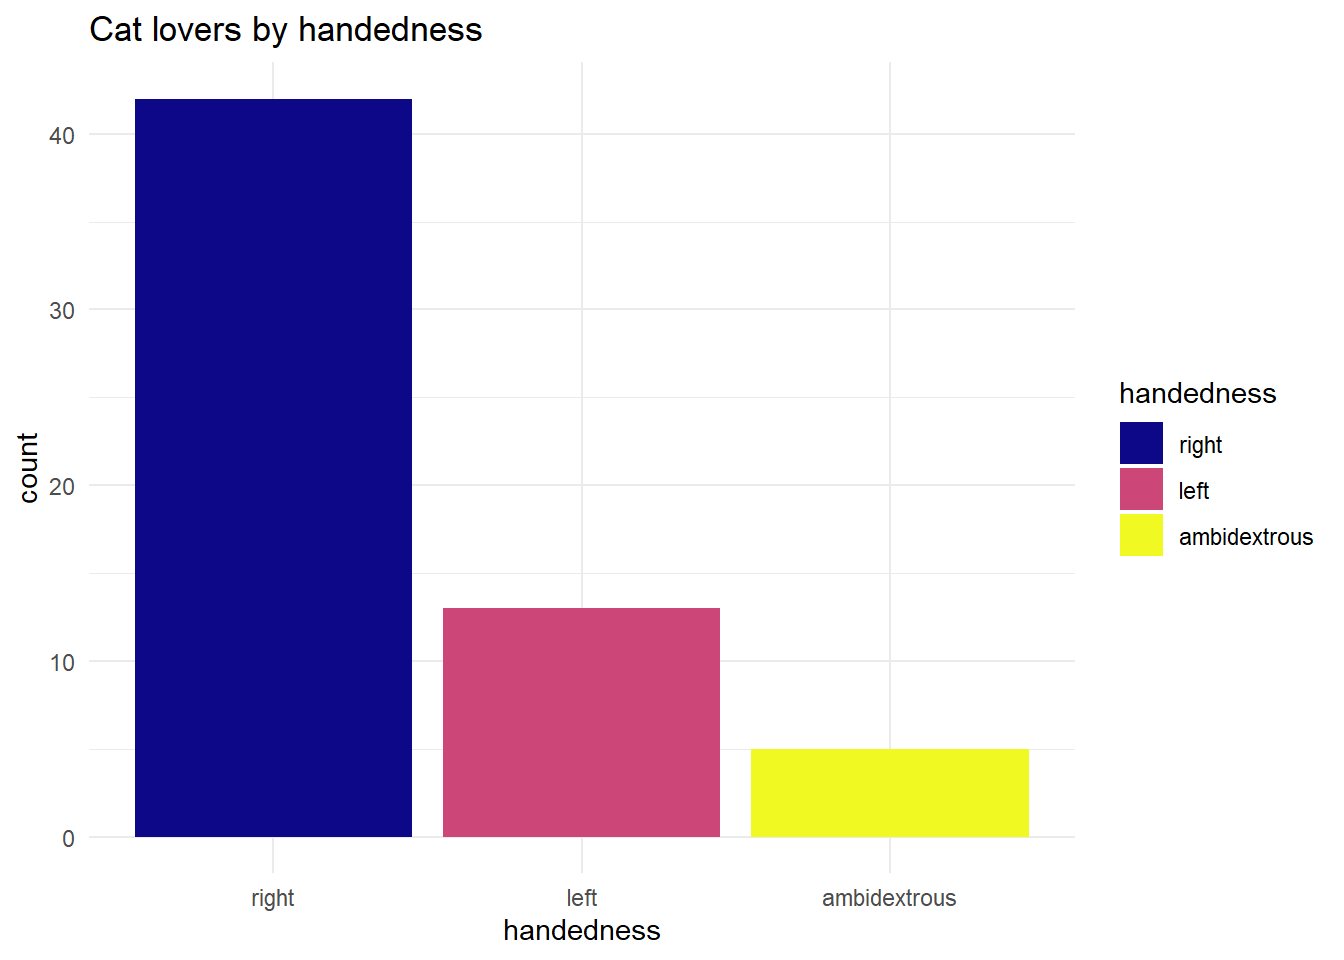
Now your most common category appears first - much more informative!
The slides show an example with months, which is a classic problem. If you don’t use factors, your months end up in alphabetical order (April, August, December…) instead of calendar order. Using fct_relevel() with month.name fixes this:
So next time your plot looks oddly ordered, remember: there’s probably a forcats function that can fix it in one line!