30 LAB: Nobel laureates
In January 2017, Buzzfeed published an article titled “These Nobel Prize Winners Show Why Immigration Is So Important for American Science”. The article highlighted that many U.S.-based Nobel laureates in the sciences were born outside the United States, emphasizing the role of immigration in scientific innovation. More recently, in December 2025, The New York Times published a related article “Nobel Prize Winners Show Why Immigration Is Vital to Science” (Gorman 2025), further reinforcing this important relationship between immigration and scientific achievement.
In this lab, you will analyze Nobel laureate data to update and extend some of the visualizations from the article. You’ll practice data wrangling and visualization using the tidyverse packages while exploring the relationship between immigration and scientific recognition. These data were pulled from the Nobel Prize API.
Learning goals
By completing this lab, you will:
- Practice replicating published results
- Perform data wrangling and visualization using
tidyverse
Lab prep
- Task: Read the Buzzfeed article titled These Nobel Prize Winners Show Why Immigration Is So Important For American Science. We will be replicating this analysis in the lab. So it’s pretty important that you’re familiar with it ahead of time.
Getting started
To begin this lab, navigate to our course’s GitHub organization and locate the repository named lab-03-nobel-laureates. Follow these steps:
Repository Setup:
- Forking: If you are working individually, fork the repository to create a personal copy under your GitHub account.
- Template Copying: If you prefer not to fork, you can also use the repository as a template. This option is particularly useful if you’re working as a group.
Clone and Open:
- Cloning: Use GitHub Desktop or the command line to clone the repository to your local machine.
- Opening the Project: Open the cloned directory in RStudio by clicking on the
lab-03-nobel-laureates.Rprojfile.
Open and Knit the R Markdown File:
- Open the
lab-03.Rmdfile in RStudio. Knit the document to ensure all code chunks run correctly and the markdown file (lab-03.md) is generated without errors.
- Open the
Update YAML Header:
- Modify the YAML header in the R Markdown document to include your name as the author and ensure other settings like date and output format are correctly specified. Knit the document again to see the updates in the output.
Commit and Push Changes: Commit your changes with a meaningful message using Git, such as “Updated YAML header with author details.” Push these changes to your GitHub repository to ensure they are properly uploaded and visible online.
Verify Changes on GitHub: Visit your GitHub repository to confirm that your changes appear correctly in both the
.Rmdand.mdfiles. This ensures that your setup is correct and that you are ready to proceed with the lab exercises.
Packages
We’ll use the tidyverse package for much of the data wrangling. This package is already installed for you. You can load them by running the following in your Console:
Data
The dataset for this assignment can be found as a csv (comma separated values) file in the data folder of your repository. You can read it in using the following. (You can also see how I created this data in the data/update_data.R script if you’re curious.)
The variable descriptions are as follows:
id: ID numberfirstname: First name of laureatesurname: Surname of laureateyear: Year prize woncategory: Category of prizeaffiliation: Affiliation of laureatecity: City of laureate in prize yearcountry: Country of laureate in prize yearborn_date: Birth date of laureatedied_date: Death date of laureategender: Gender of laureateborn_city: City where laureate was bornborn_country: Country where laureate was bornborn_country_code: Code of country where laureate was borndied_city: City where laureate dieddied_country: Country where laureate dieddied_country_code: Code of country where laureate diedoverall_motivation: Overall motivation for recognitionshare: Number of other winners award is shared withmotivation: Motivation for recognition
In a few cases, the name of the city/country changed after laureate was given (e.g., in 1975, Bosnia and Herzegovina was called the Socialist Federative Republic of Yugoslavia).
In these cases the variables below reflect a different name than their counterparts without the suffix _original.
born_country_original: Original country where laureate was bornborn_city_original: Original city where laureate was borndied_country_original: Original country where laureate dieddied_city_original: Original city where laureate diedcity_original: Original city where laureate lived at the time of winning the awardcountry_original: Original country where laureate lived at the time of winning the award
As a quick exploratory step, let’s create a world map that visualizes the number of Nobel laureates by their birth country.
## 82 codes from your data successfully matched countries in the map
## 1 codes from your data failed to match with a country code in the map
## 160 codes from the map weren't represented in your data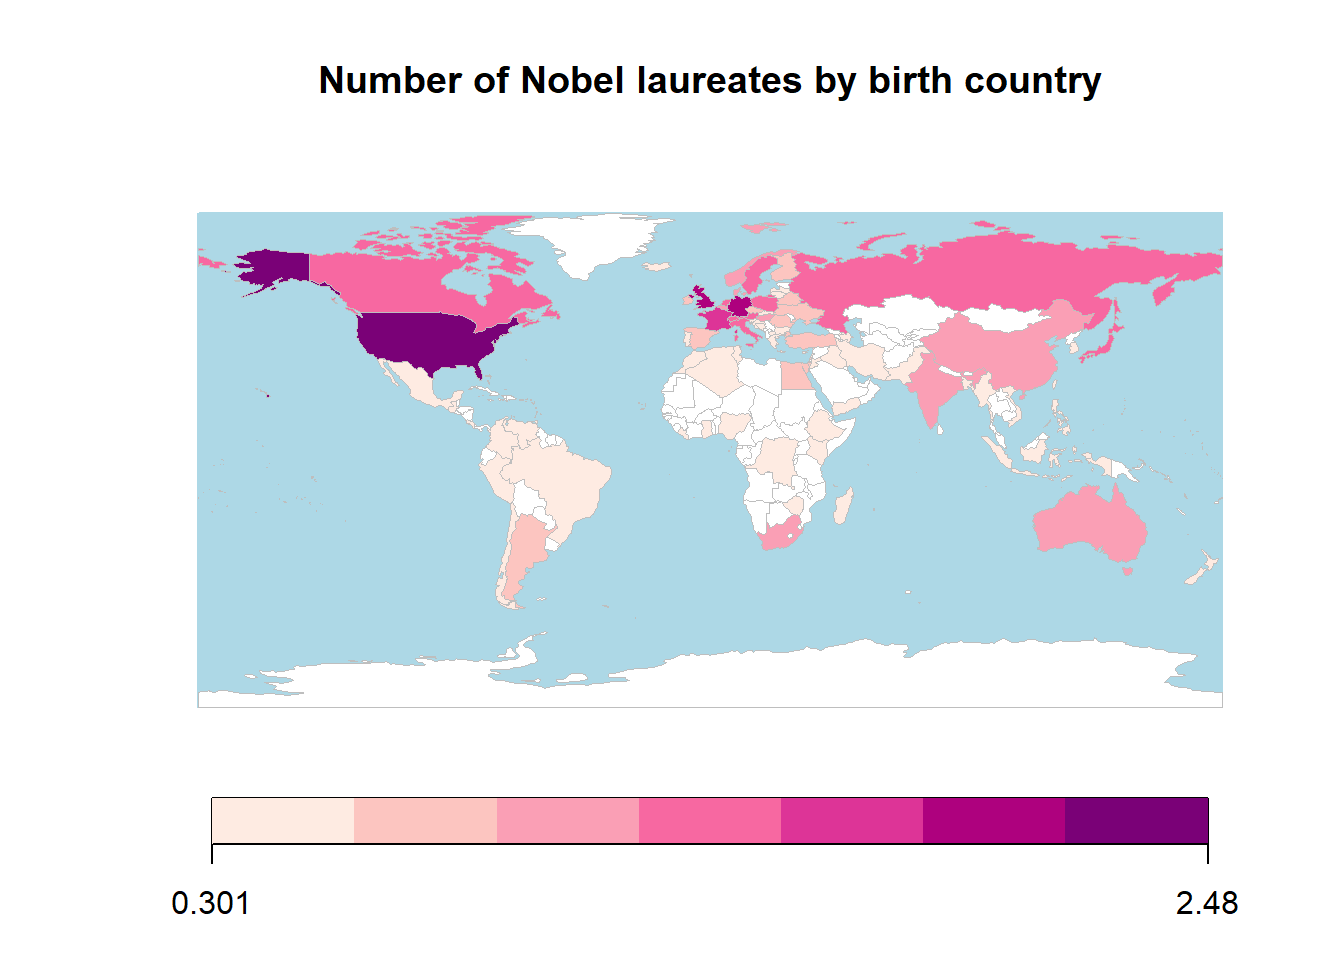
This map provides a global overview of the distribution of Nobel laureates based on their birth countries. Countries with higher numbers of laureates are represented with darker shades, while those with fewer or no laureates are shown in lighter shades or white. These data have been log-transformed to ensure better visualization across countries with varying counts of laureates. To gain deeper insights, we will now proceed to analyze the data further through a series of exercises.
Exercises
Get to know your data
- How many observations and how many variables are in the dataset? Use inline code to answer this question. What does each row represent?
There are some observations in this dataset that we will exclude from our analysis to match the Buzzfeed results.
- Create a new data frame called
nobel_livingthat filters for
- laureates who are still alive (their
died_dateisNA), as well as - laureates for whom
countryis available - laureates who are people as opposed to organizations (organizations are denoted with
"org"as theirgender)
Confirm that once you have filtered for these characteristics you are left with a data frame with 251 observations, once again using inline code.
🧶 ✅ ⬆️ Knit, commit, and push your changes to GitHub with an appropriate commit message. Make sure to commit and push all changed files so that your Git pane is cleared up afterwards.
Most living Nobel laureates were based in the US when they won their prizes
… says the Buzzfeed article. Let’s see if that’s true.
First, we’ll create a new variable to identify whether the laureate was in the US when they won their prize.
We’ll use the mutate() function for this.
The following pipeline mutates the nobel_living data frame by adding a new variable called country_us.
We use an if statement to create this variable.
The first argument in the if_else() function we’re using to write this if statement is the condition we’re testing for.
If country is equal to "USA", we set country_us to "USA".
If not, we set the country_us to "Other".
Note: We can achieve the same result using the
fct_other()function we’ve seen before (i.e. withcountry_us = fct_other(country, "USA")). We decided to use theif_else()here to show you one example of an if statement in R.
Next, we will limit our analysis to only the following categories: Physics, Medicine, Chemistry, and Economics.
Note: Technically, the Nobel Prize in Economics is a memorial prize. It was established in 1968. If you want to annoy an economist, point that distinction out to them… More info here if you want to learn some more.
nobel_living_science <- nobel_living %>%
  filter(category %in% c("Physics", "Medicine", "Chemistry", "Economics"))
For the next exercise, work with the nobel_living_science data frame you created above.
You’ll need to define this data frame in your R Markdown document, even though the next exercise doesn’t explicitly ask you to do so.
Create a faceted bar plot visualizing the relationship between the category of prize and whether the laureate was in the US when they won the nobel prize. Interpret your visualization, and say a few words about whether the Buzzfeed headline is supported by the data.
- Your visualization should be faceted by category.
- For each facet you should have two bars, one for winners in the US and one for Other.
- Flip the coordinates so the bars are horizontal, not vertical.
🧶 ✅ ⬆️ Knit, commit, and push your changes to GitHub with an appropriate commit message. Make sure to commit and push all changed files so that your Git pane is cleared up afterwards.
But of those US-based Nobel laureates, many were born in other countries
Hint: You should be able to
cheatborrow from code you used earlier to create thecountry_usvariable.
Create a new variable called
born_country_usthat has the value"USA"if the laureate is born in the US, and"Other"otherwise. How many of the winners are born in the US?Add a second variable to your visualization from Exercise 3 based on whether the laureate was born in the US or not. Based on your visualization, do the data appear to support Buzzfeed’s claim? Explain your reasoning in 1-2 sentences.
- Your final visualization should contain a facet for each category.
- Within each facet, there should be a bar for whether the laureate won the award in the US or not.
- Each bar should have segments for whether the laureate was born in the US or not.
🧶 ✅ ⬆️ Knit, commit, and push your changes to GitHub with an appropriate commit message. Make sure to commit and push all changed files so that your Git pane is cleared up afterwards.
Here’s where those immigrant Nobelists were born
Note: Your bar plot won’t exactly match the one from the Buzzfeed article. We’re using data pulled directly from the Nobel Prize API, which is more up to date than the data used in the Buzzfeed article. So don’t worry if your plot looks a little different!
- In a single pipeline, filter for laureates who won their prize in the US, but were born outside of the US, and then create a frequency table (with the
count()function) for their birth country (born_country) and arrange the resulting data frame in descending order of number of observations for each country. Which country is the most common?
🧶 ✅ ⬆️ Knit, commit, and push your changes to GitHub with an appropriate commit message. Make sure to commit and push all changed files so that your Git pane is cleared up afterwards and review the md document on GitHub to make sure you’re happy with the final state of your work.
Now go back through your write up to make sure you’ve answered all questions and all of your R chunks are properly labeled.
Interested in how Buzzfeed made their visualizations?
The plots in the Buzzfeed article are called waffle plots. You can find the code used for making these plots in Buzzfeed’s GitHub repo (yes, they have one!) here. You’re not expected to recreate them as part of your assignment, but you’re welcomed to do so for fun!