3 Meet our toolbox
You can follow along with the slides here if they do not appear below. I recommend installing R, Rstudio, git, and github before starting activity 02
3.1 Reproducible data analysis
What does it mean for a data analysis to be “reproducible”? This concept is at the heart of scientific integrity and a cornerstone of data science practice. It means that the results of your analysis can be recreated by others, and that your work is transparent and verifiable. Being able to reproduce the results of an analysis ensures that the conclusions drawn are reliable and can be built upon by future work.
3.1.1 Reproducibility checklist
To gauge the reproducibility of a data analysis, consider the following near-term and long-term goals:
Near-term goals:
- Are the tables and figures reproducible from the code and data? Everything we claim should be directly reproducible by running the code we’ve written.
- Does the code actually do what you think it does? Verify that your code executes correctly and achieves its intended purpose.
Mid-term goals:
Is the code well-organized and documented? Structured and well-documented code is easier to understand and maintain.
Can someone else understand what you did? The code should be clear and well-documented so that others can understand and build upon it.
Can someone else understand why you did what you did? Understanding the rationale behind decisions, such as parameter settings, enhances clarity and reproducibility.
Long-term goals:
- Can the code be used for other data? Flexibility in code for reuse with different datasets broadens the applicability of your work.
- Can you extend the code to do other things? Structure your projects so that your codebase can be easily expanded for additional analyses or functionalities. Being able to build upon existing code without starting from scratch each time accelerates progress.
3.2 Toolkit for Reproducible Data Analysis
A successful data analyst in psychology relies on a core set of tools:
- Scriptability using R, enabling direct manipulation of data.
- Literate programming with R Markdown, which integrates code, narrative, and output.
- Version control through Git/GitHub, documenting project evolution and facilitating collaboration.
The toolkit empowers us to achieve our reproducibility goals and supports a structured and efficient workflow:
3.3 R and RStudio
3.3.1 Install R and RStudio
Install R, a free software environment for statistical computing and graphics from CRAN, the Comprehensive R Archive Network. I highly recommend you install a precompiled binary distribution for your operating system – use the links up at the top of the CRAN page linked above!
Install RStudio’s IDE (stands for integrated development environment), a powerful user interface for R. Get the Open Source Edition of RStudio Desktop.
- You can run either the Preview version or the official releases available here.
- RStudio comes with a text editor, so there is no immediate need to install a separate stand-alone editor.
- RStudio can interface with Git(Hub). However, you must do all the Git(Hub) set up described elsewhere before you can take advantage of this.
If you have a pre-existing installation of R and/or RStudio, I highly recommend that you reinstall both and get as current as possible. It can be considerably harder to run old software than new.
- If you upgrade R, you will need to update any packages you have installed. The command below should get you started, though you may need to specify more arguments if, e.g., you have been using a non-default library for your packages.
Note: this code will only look for updates on CRAN. So if you use a package that lives only on GitHub or if you want a development version from GitHub, you will need to update manually, e.g. via devtools::install_github().
3.3.2 Testing testing
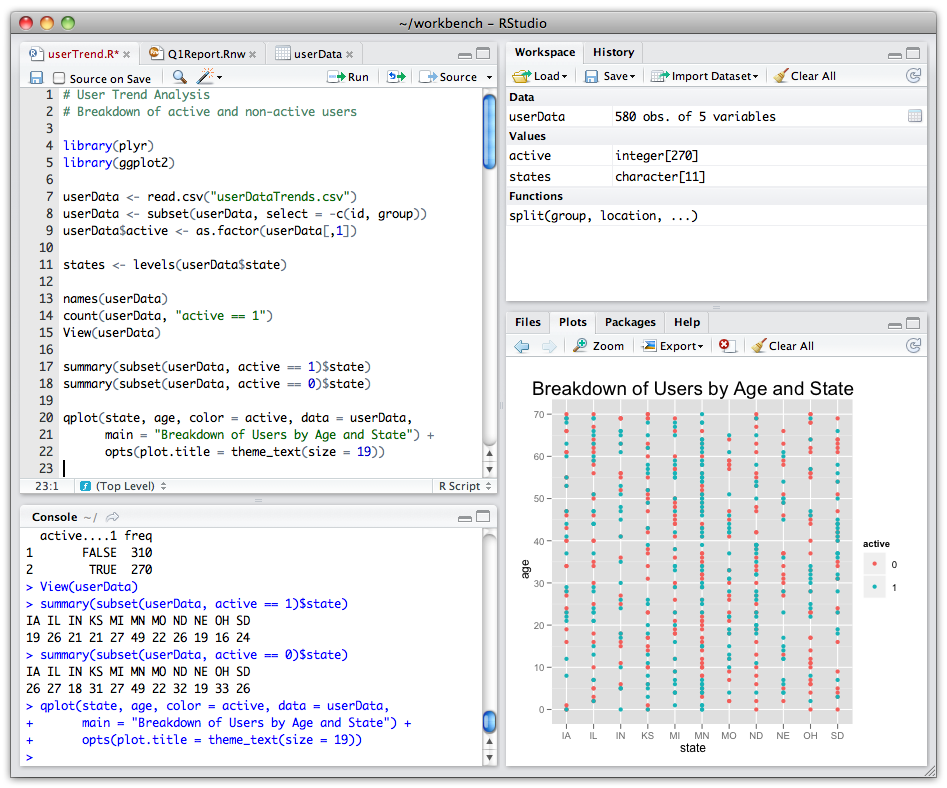
Do whatever is appropriate for your OS to launch RStudio. You should get a window similar to the screenshot you see here, but yours will be more boring because you haven’t written any code or made any figures yet!
Put your cursor in the pane labeled Console, which is where you interact with the live R process. Create a simple object with code like
x <- 3 * 4(followed by enter or return). Then inspect thexobject by typingxfollowed by enter or return. You should see the value 12 print to screen. If yes, you’ve succeeded in installing R and RStudio.
3.3.3 Add-on packages
R is an extensible system and many people share useful code they have developed as a package via CRAN and GitHub. To install a package from CRAN, for example the dplyr package for data manipulation, here is one way to do it in the R console (there are others).
By including dependencies = TRUE, we are being explicit and extra-careful to install any additional packages the target package, dplyr in the example above, needs to have around.
You could use the above method to install the following packages, all of which we will use:
- tidyr, package webpage
- ggplot2, package webpage